Public Art: Measuring Value and Feedback with the QR Code
View our pitch deck here.
“There is a dearth of research efforts focusing on public art and its impact. The evidence is mostly anecdotal. Some attempts have focused specifically on economic impact, but this doesn’t tell the whole story, or even the most important stories.”
Overview
The San Francisco Arts Commission (SFAC), established in 1932, is responsible for providing public art that inspires experiences and offers engaging conversation.
The SFAC was interested in knowing if locals and travelers value or acknowledge the installations they approve.
Essentially, do people interact or care for public art in San Francisco? At the moment, there is no way to measure whether locals or tourists are taking the time to understand and experience public art.
Team and Role
My team consisted of three UX designers including myself with backgrounds in educational studies, art history and tech.
My role was to collaborate trough clear communication, provide common research practices, and inform design/interaction conventions.
I specifically contributed to my team by creating a survey, conducting in-person interviews with the appropriate candidates, defining major insights from affinity mapping, establishing personas that coincide with those interested in public art, and overall, guided the team in daily stand ups with agile methodologies to move forward.
UX Methodologies
Survey
Qualitative & Quantitative Data
Field Study / Contextual Inquiry
Competitive Research
In-person interviews
Affinity Mapping
Empathy mapping
Personas
User Journeys
Design Studio
Feature Prioritization
The Challenge
Going back to the initial questions at the start, our challenge was to understand how people currently interact with public art. How can we revolutionize interaction with public art and provide the SFAC with hard data.
The Solution
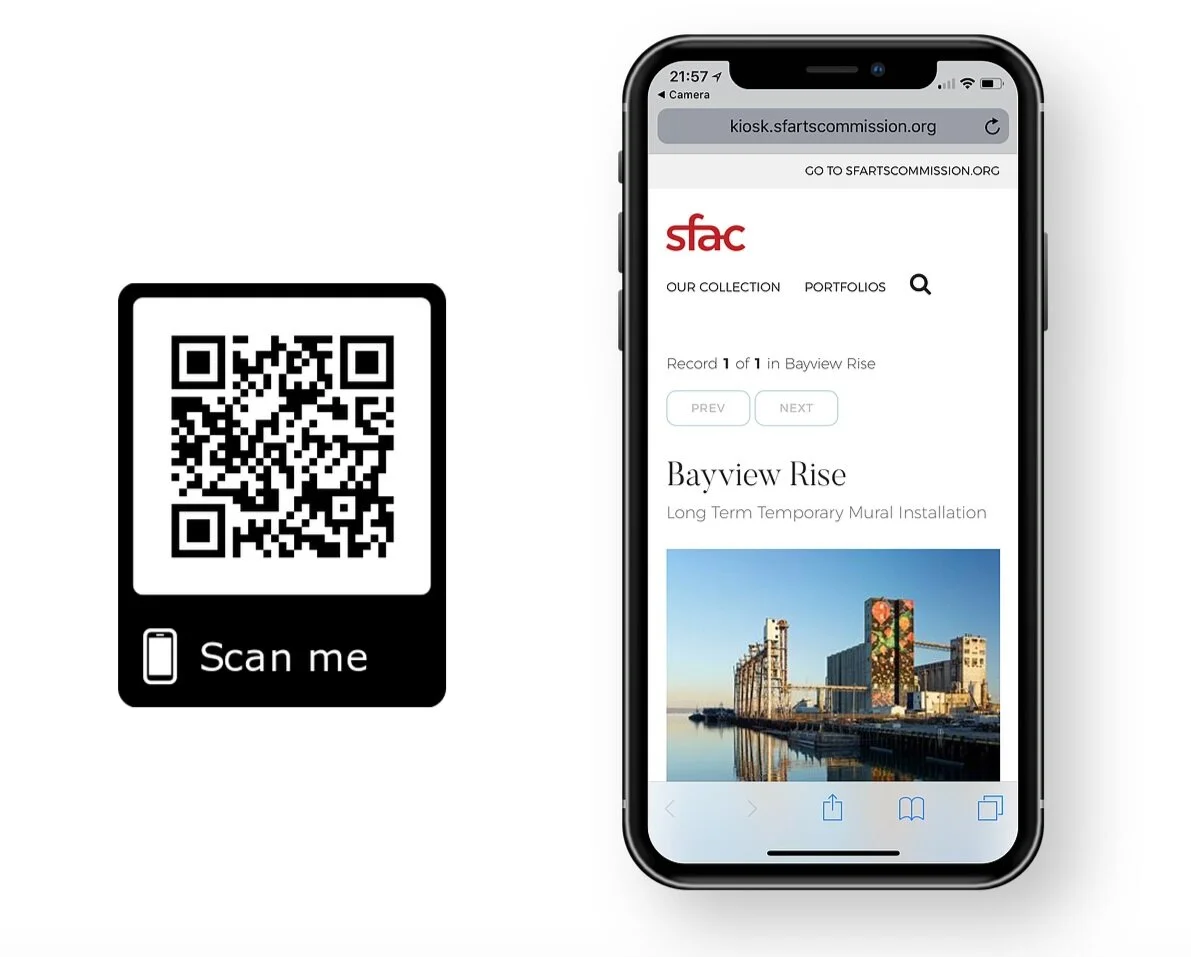
Install a QR code around public art pieces for spectators to scan with their phones.
In our first attempt to understand this MVP, we tested it out by putting QR codes at public art sites. We also tested a feedback box at different public art sites to see whether there might be different engagement levels.
Our final pitched designed was the QR code as it received a higher percentage of engagement.
Step 1: Discovery & Research
Such concerns provided my team with initial questions:
What types of individuals go out and seek public art? Who is our targeted audience?
How do we measure their engagement?
How can we provide the SFAC with data to help them understand how valuable each work of art is to the public?
Survey
With only two weeks to execute this project our team decided we needed to gather some qualitative and quantitative data fast. This fueled us to create a survey, where we ended up getting 60 responses from people of all different backgrounds that currently live in the San Francisco Bay area.
Our most profound insights that we gathered were the following:
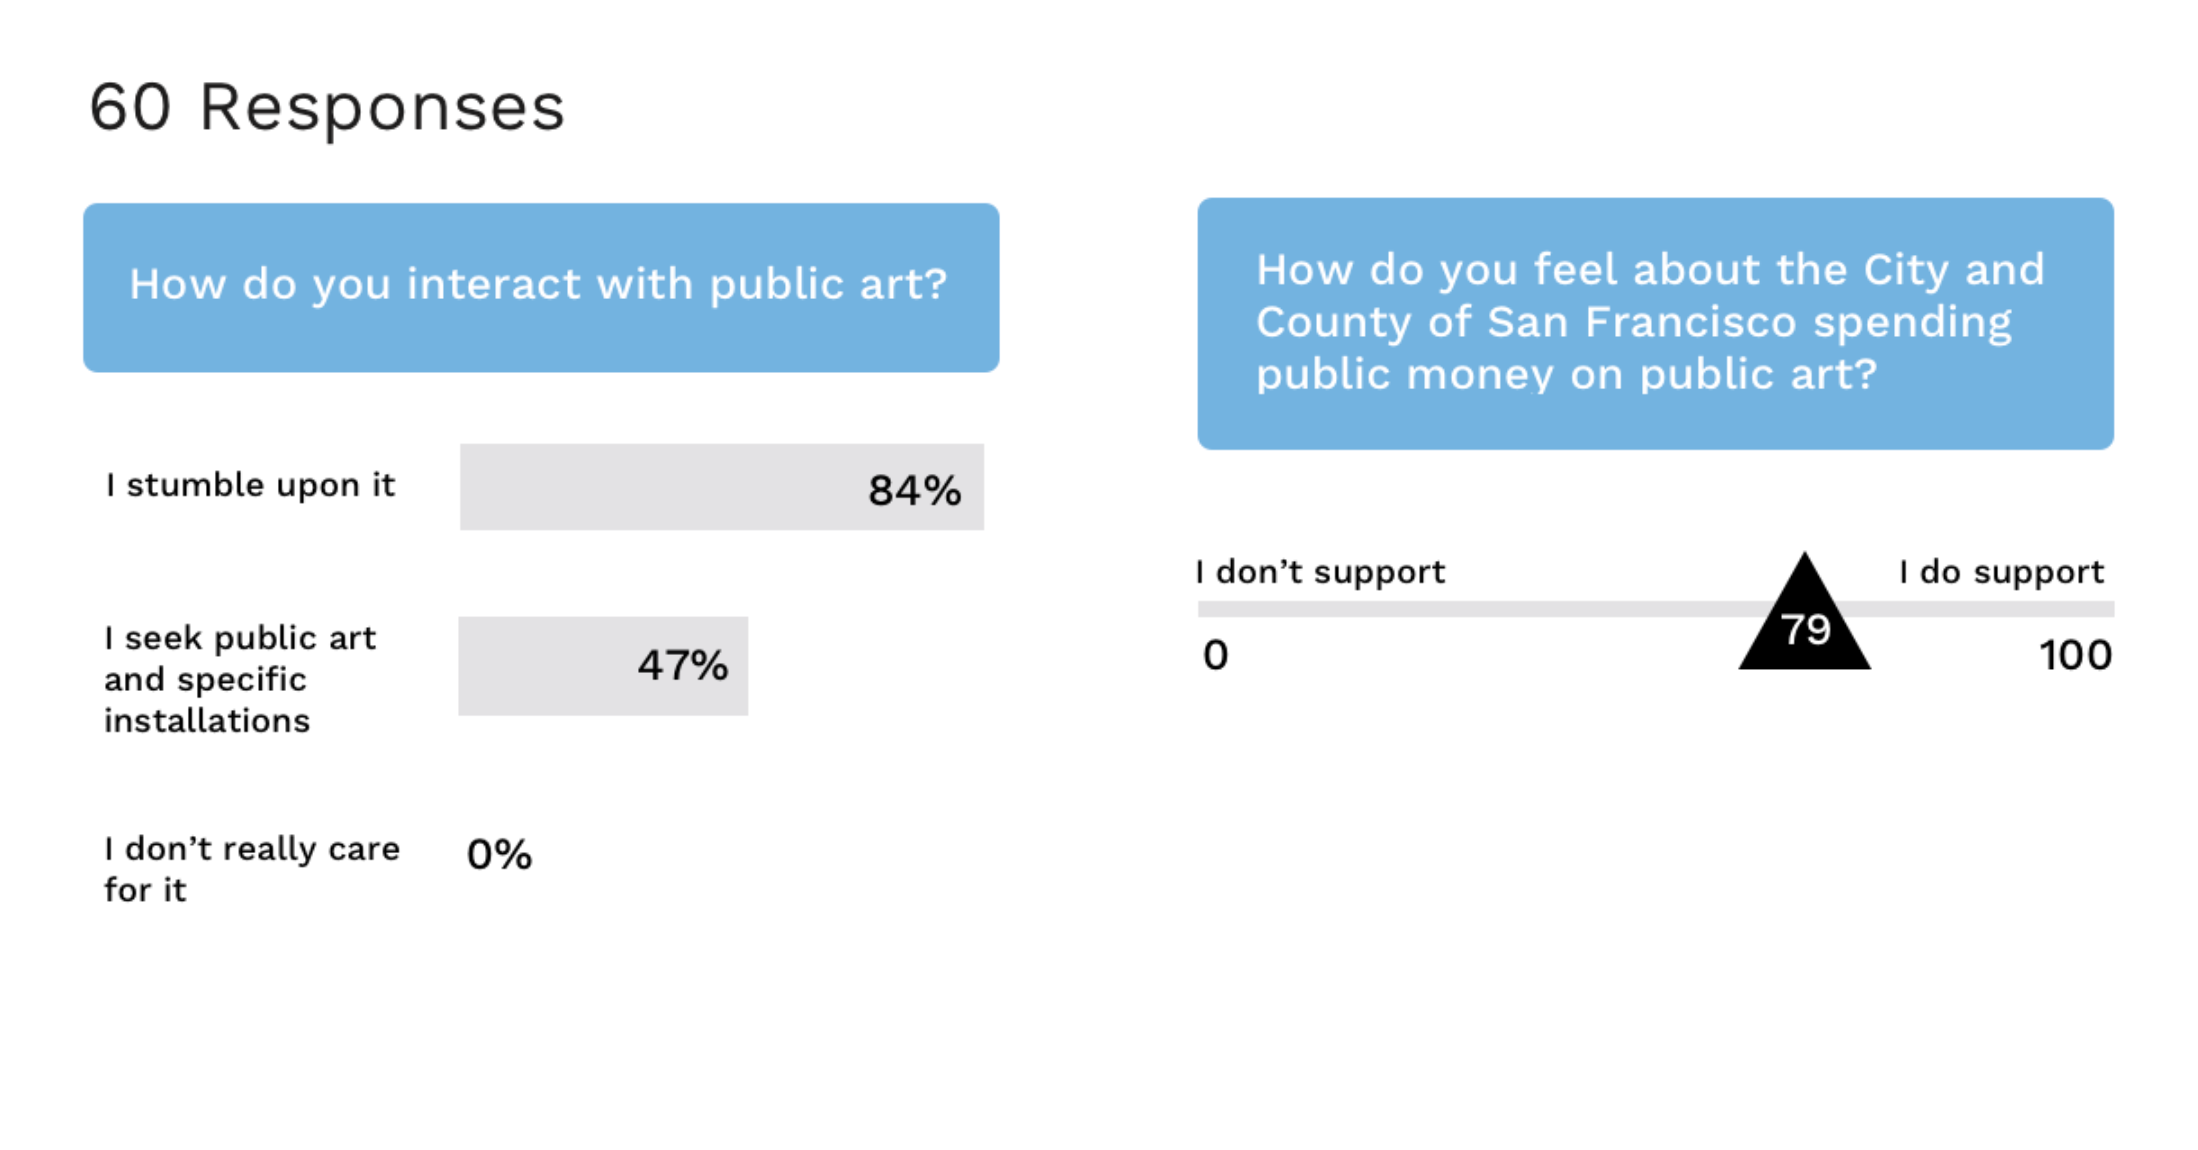
Qualitative Data
Insights gathered from our survey
Curiousity Strikes More Research
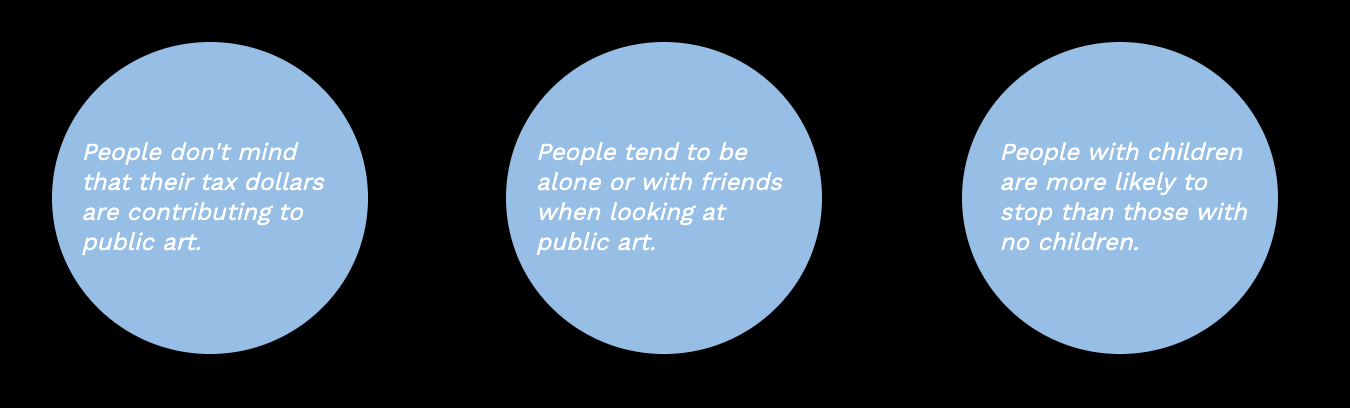
Through the initial insights gathered from the survey, we were enlightened to get out of the building and conduct a field study at Embarcadero Center where we could observe how people on-average interact with a public art work around 2 p.m. in the afternoon.
Field Study Analytics
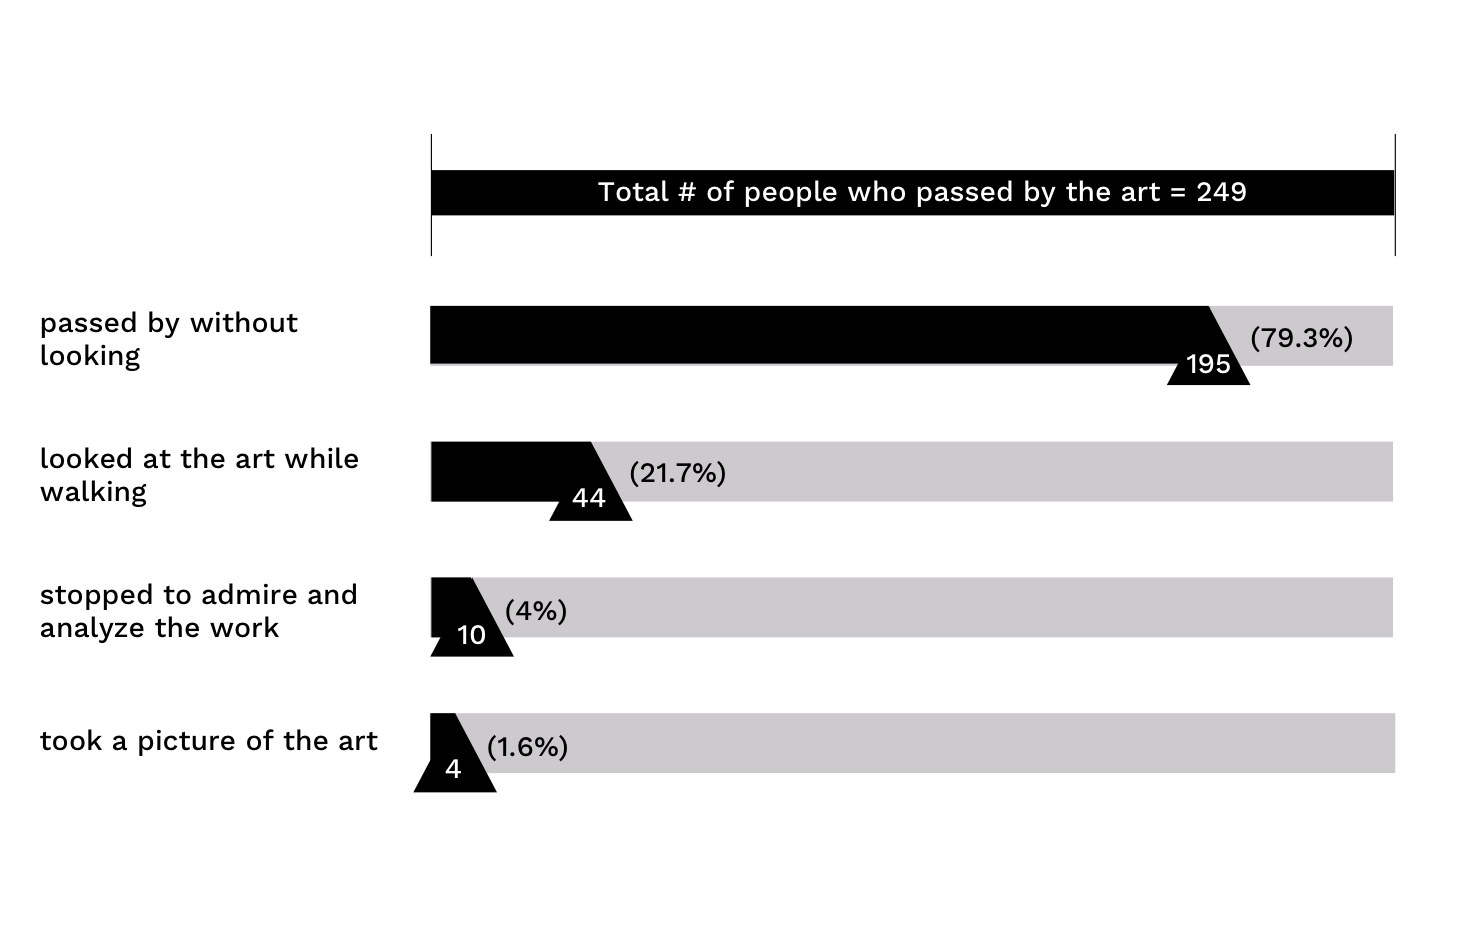
While we observed and asked questions to those around the public art, we also noticed and analyzed individuals engagement with the art.
For example, one spectator was only there to eat their lunch versus a tourist who was engaged with his kids. All of the data gathered migrated to post-it notes and then we built an affinity map.
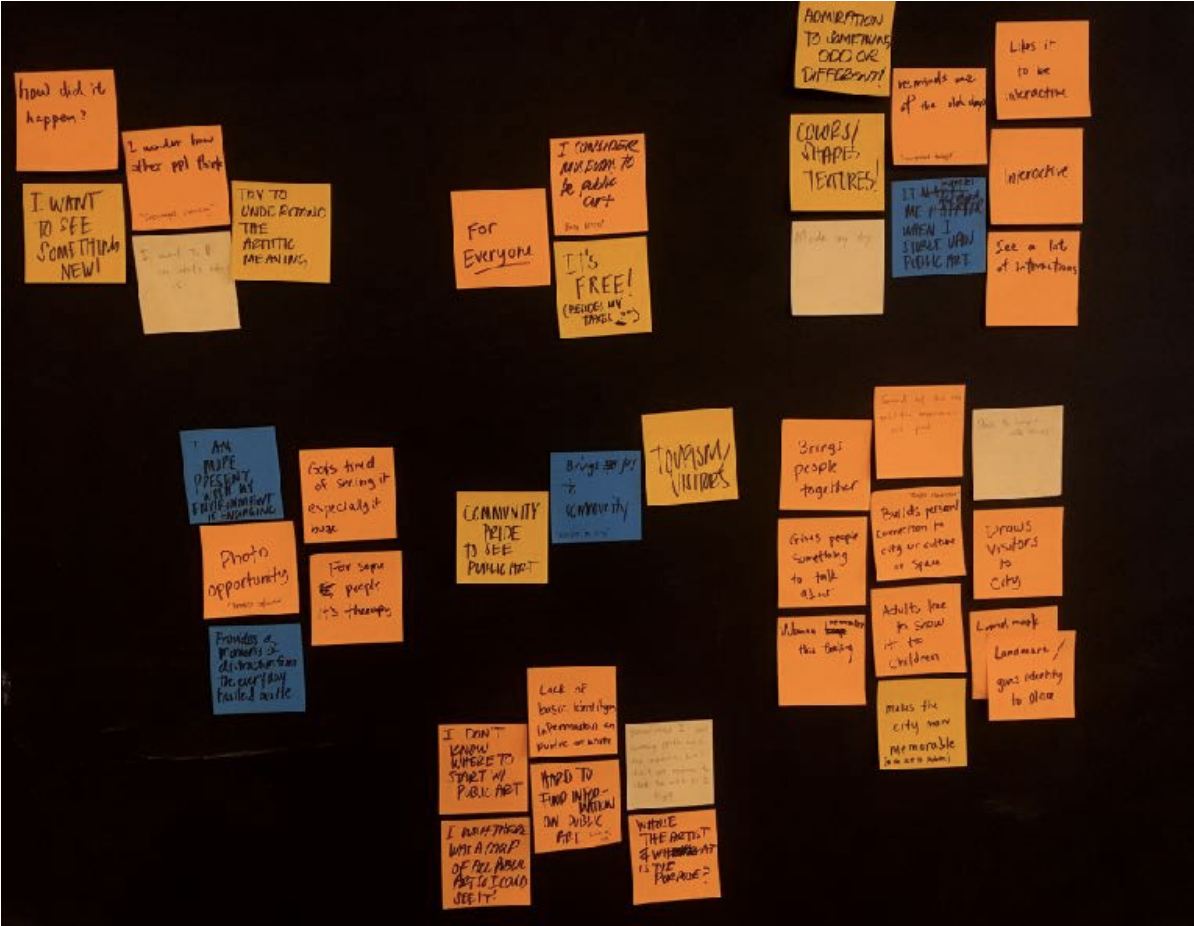
Insights gathered from our affinity map:
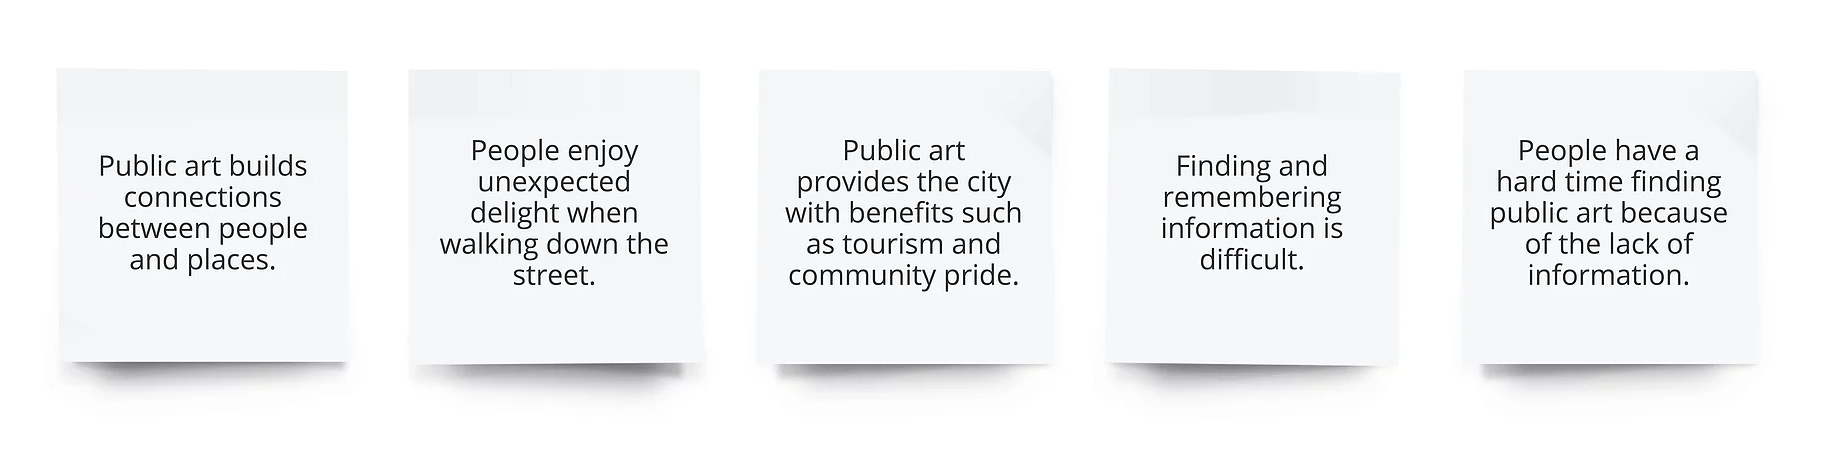
The Problem
After conducting initial research, we discovered a few problems:
First, the SFAC needs a way to provide information in a noticeable fashion. There is not enough information at the site of most works, so viewers are clueless to its' meaning or inspiration by the artist.
Secondly, there is no place to measure engagement, because there is no information provided about what the work is about.
The Solution
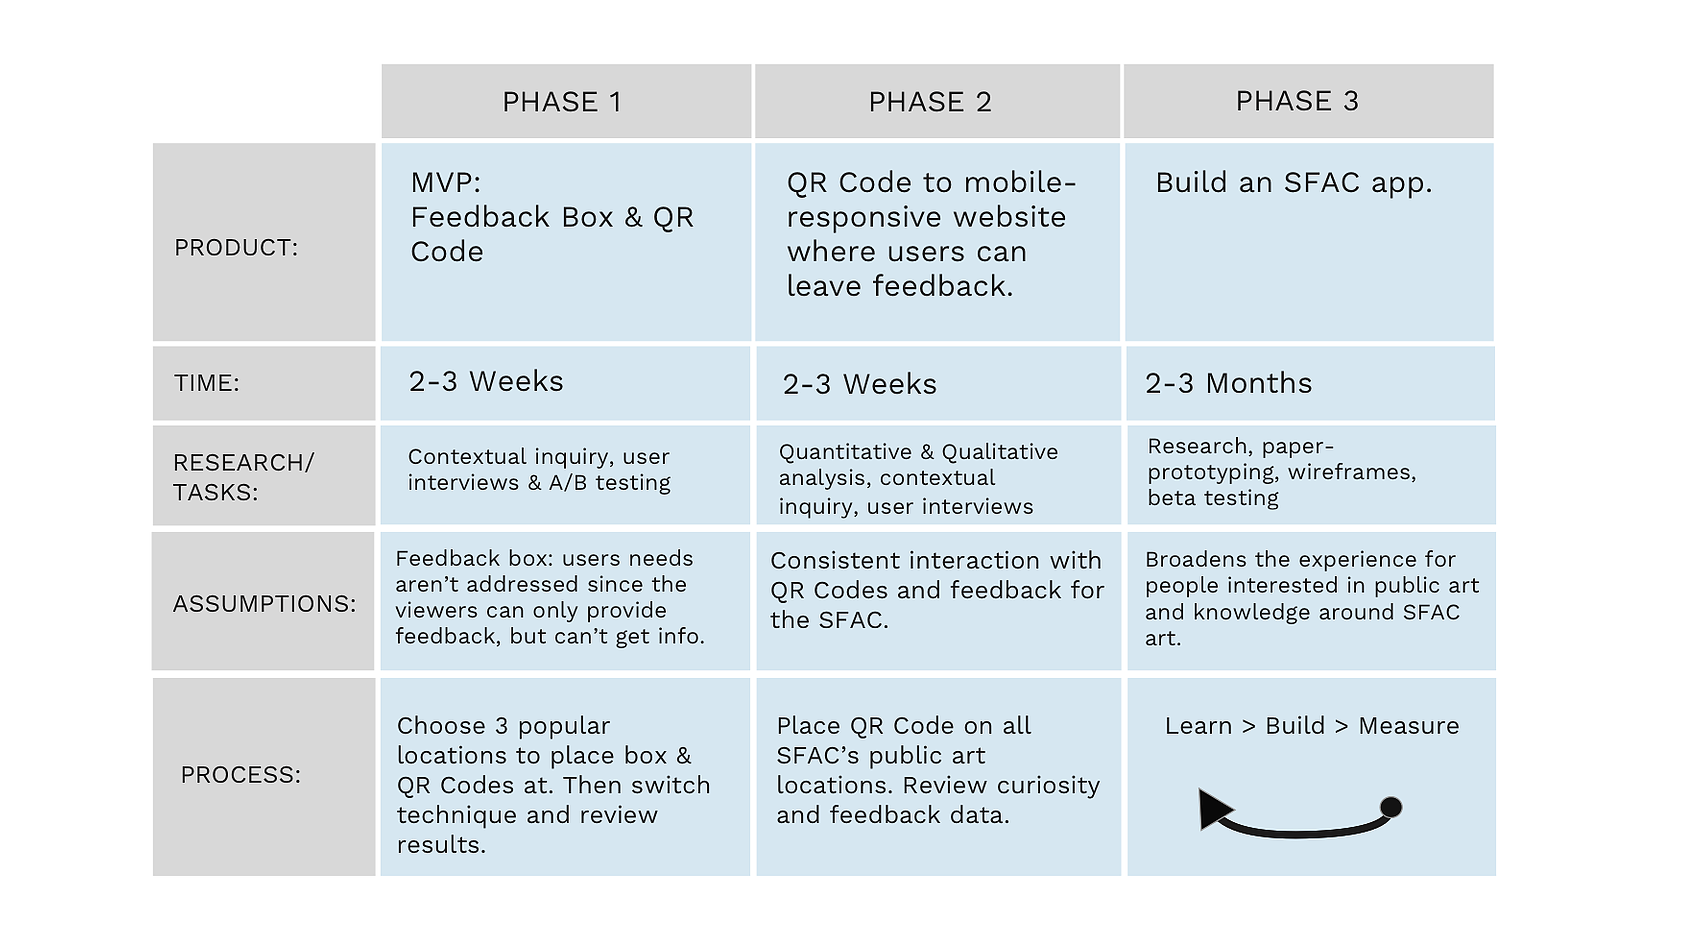
Our team designed a three-phase solution plan compromised of three minimum viable products with the assumption that each phase should improve engagement.
Our first MVP was a feedback box, but we tested this out and realized that it only helped the SFAC and not the spectator. This lead us to the most realistic MVP, which was to implement a QR code that connected to a mobile-responsive website at the site of each public art work. In that, it provided information to the viewer, as well as data for the SFAC.
If engagement were to improve and we had more time to work on the project, our team would have conducted more research and planned to create an SFAC app with the most viable features.
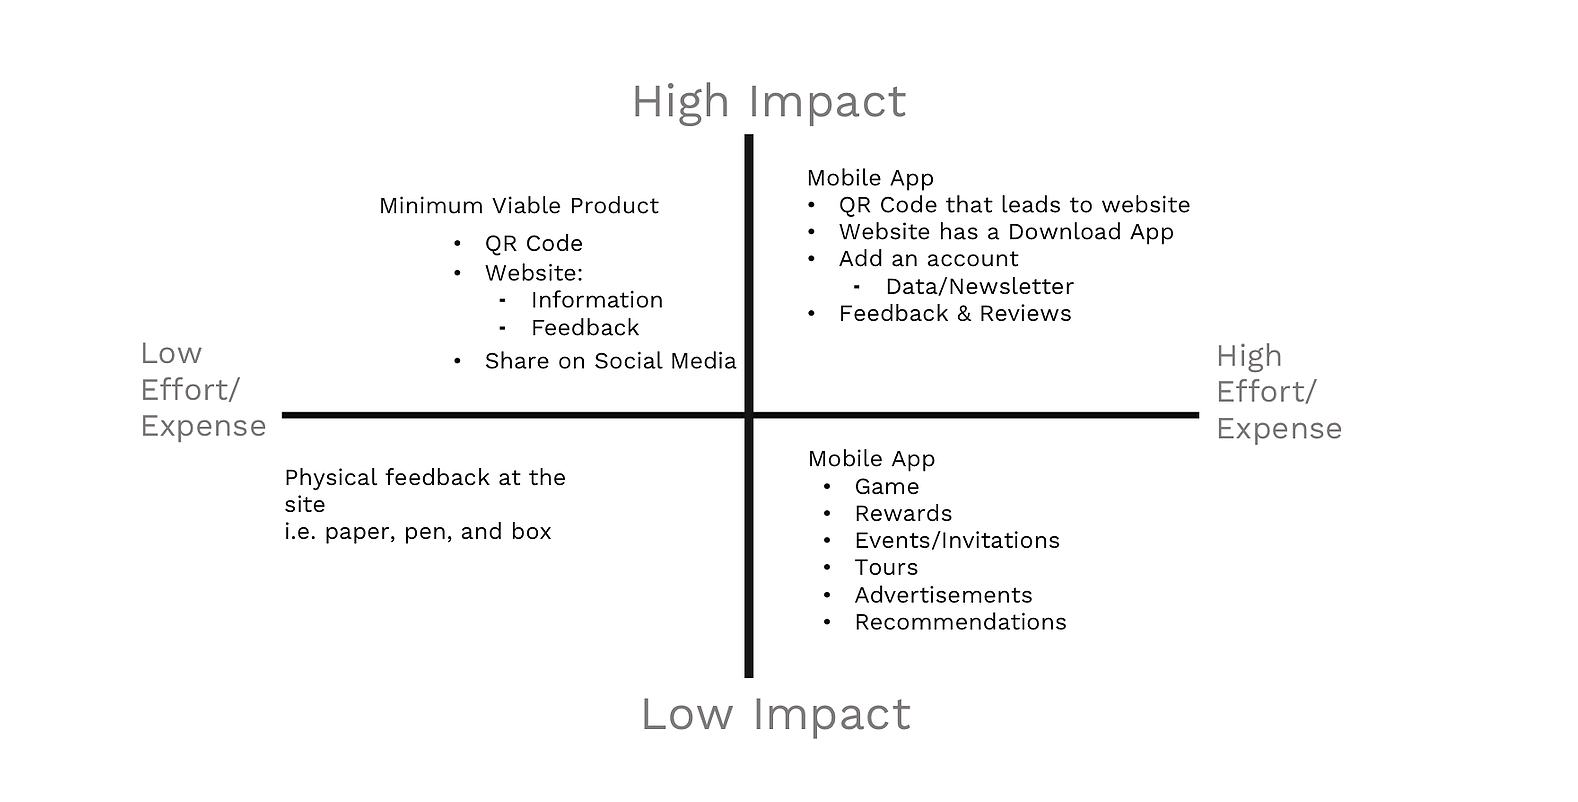
Feature Prioritization
Our team also wanted to provide the SFAC with an analysis of how much each MVP would impact the problem, as well as an analysis of expenses to implement such ideas.
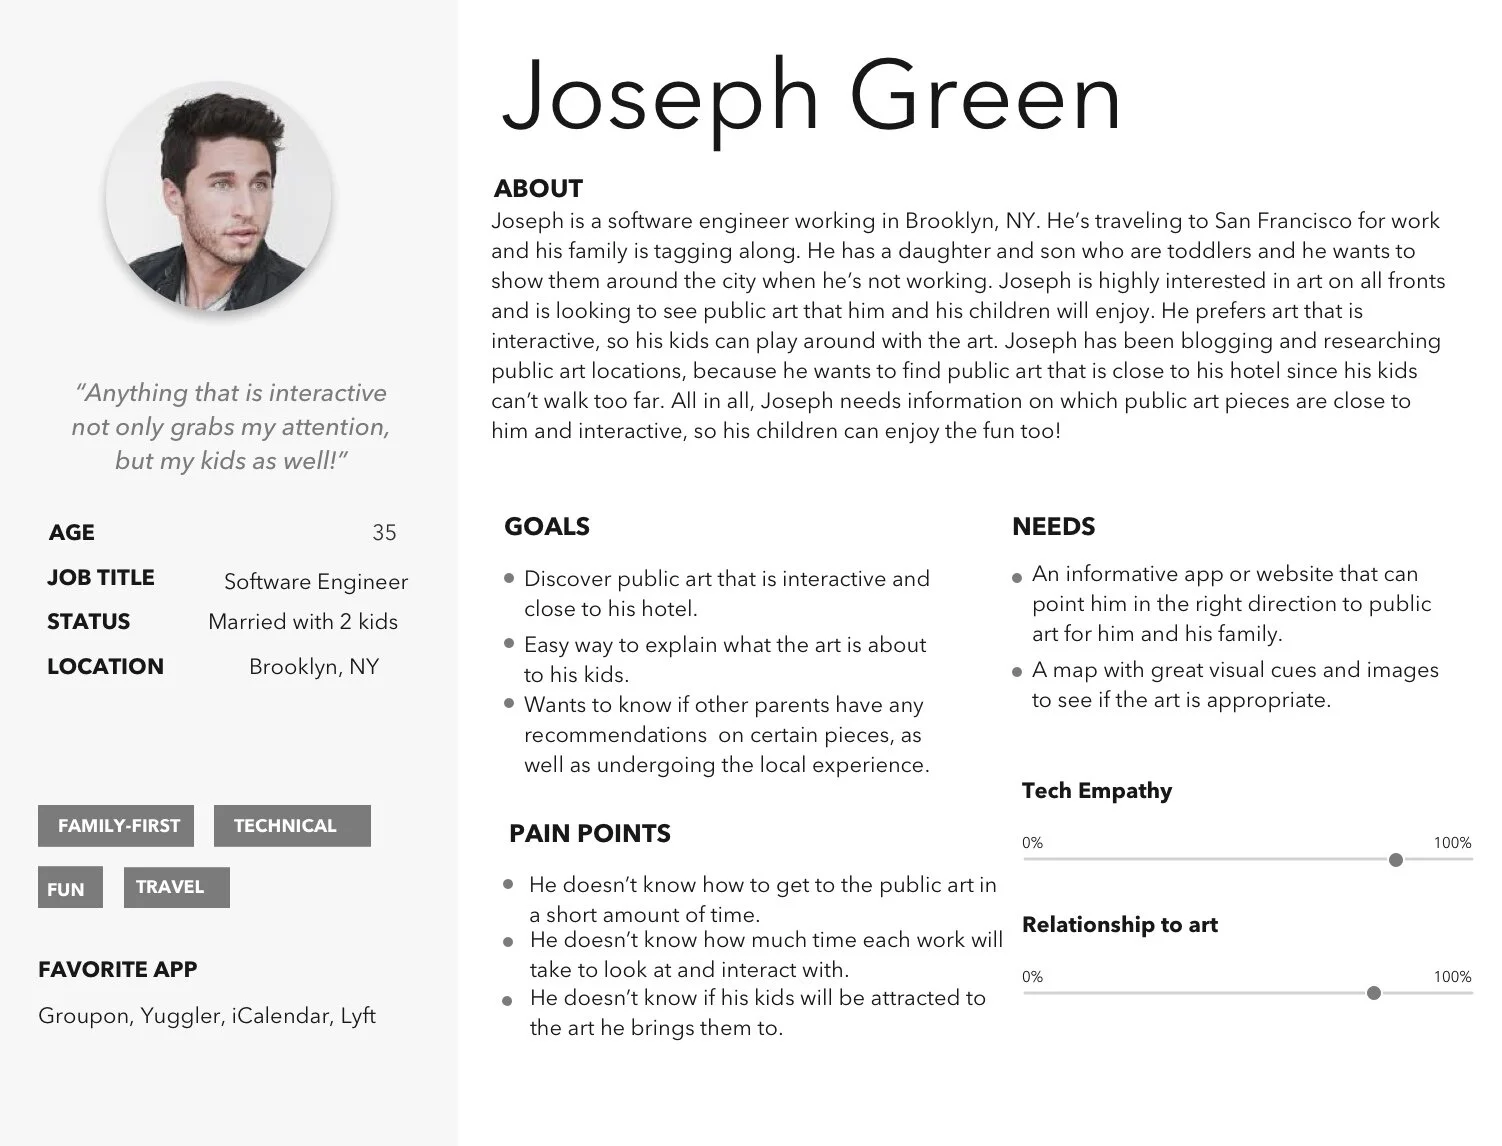
Persona Creation
In support of our solution, we also wanted to provide the SFAC with prospective users through persona building. By understanding the users goals and motivations, we can better prepare and predict how the solution affects targeted users. Each one of us created a persona, I introduced, Joseph:
The Plan and Next Steps
Our team concluded that all of our findings supported the QR Code as the best solution to measure public art. Through more research, we found success in other cities where the QR Code has been implemented to help citizens. Cities like China, the city of Manor, Texas, and 'talking statues' landmarked all over the world, all prove the QR Code is a less-expensive method which provides great impact in the ability to scale interaction.
Our team provided the stakeholders with the below plan targeting an MVP of the QR Code; we assumed each phase would grow in interaction, leading to a full design of the SFAC app. Next steps, with a bigger budget, would be to design an SFAC app with our features.